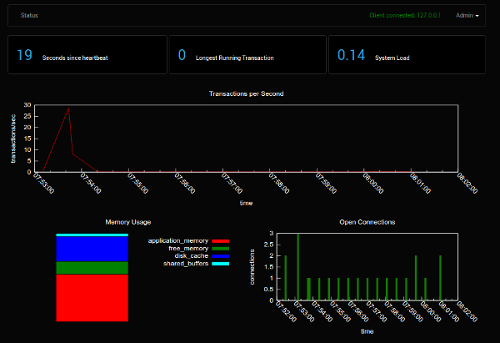
Monitoring Framework
Keep track of a cluster's current and historical status with live data from pgsampler.
Write alerts with SQL
Has your cluster sent a heartbeat in the last minute? Alert Documentation
SELECT measured_at as will_alert_if_null
  FROM heartbeats
    WHERE measured_at > (clock_timestamp() - interval '1 minute')
  LIMIT 1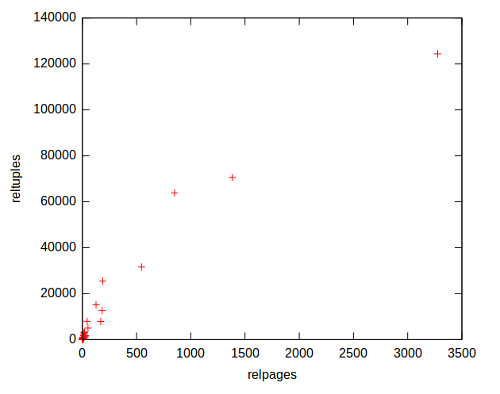
Plot Data with SQL
Query metric tables to seamlessly create plots with plotpg.
select distinct on (table_id) relpages, reltuples
  from stat_class
    where reltuples > 0;
A Historical Record.
Analyze historical data with SQL and familiar tools in a dedicated, containerized cluster.
pgantenna=# select measured_at, checkpoints_timed, checkpoints_req, buffers_checkpoint
              from stat_bgwriter
                order by measured_at asc;

 measured_at   | checkpoints_timed | checkpoints_req | buffers_checkpoint
---------------+-------------------+-----------------+-------------------
 22:39:45.3425 |                 0 |               0 |                 0
 22:42:57.4796 |                 1 |               0 |                82
 22:46:09.5859 |                 1 |               0 |                82
 22:49:21.6735 |                 2 |               0 |               115
 22:52:33.7706 |                 3 |               0 |               135
 22:55:36.8682 |                 3 |               0 |               135
(6 rows)
Getting Started
The easiest way to run pgantenna is to start a Docker container.
$ docker run -p 24831:24831 -p 80:80 no0p/pgantenna Next, install and configure pgsampler in your cluster.