plotpg

plotting postgresql result sets


Source Code     Documentation

Example

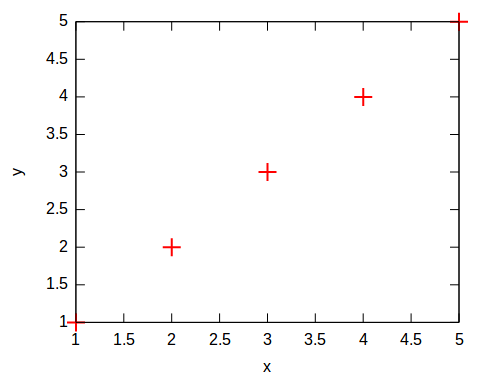
=# create table data (x int, y int);
=# insert into data values (1, 1), (2, 2), (3, 3), (4, 4);
=# select plot('select x, y from data');
       plot
-------------------
 <?xml version="1.0" encoding="utf-8"....
 <svg>.... 

Or plot directly in psql.


=# select plot('select x, y from data', 'set style data lines;');

                                                    plot                                                     
-------------------------------------------------------------------------------------------------------------
                                                                                                            +
     5 ++-----------+-----------+------------+-----------+------------+-----------+------------+--------****+
       +            +           +            +           +            +           +            +  ******   ++
   4.5 ++                                                                                   ******        +++
       |                                                                              ******               |+
     4 ++                                                                       ******                    +++
       |                                                                   *****                           |+
       |                                                              *****                                |+
   3.5 ++                                                        *****                                    +++
       |                                                    *****                                          |+
     3 ++                                             ******                                              +++
       |                                        ******                                                     |+
   2.5 ++                                 ******                                                          +++
       |                            ******                                                                 |+
     2 ++                     ******                                                                      +++
       |                 *****                                                                             |+
       |            *****                                                                                  |+
   1.5 ++      *****                                                                                      +++
       +  *****     +           +            +           +            +           +            +           ++
     1 ***----------+-----------+------------+-----------+------------+-----------+------------+----------+++
       1           1.5          2           2.5          3           3.5          4           4.5          5+
                                                         x                                                  +
                                                                                                            +
 
(1 row)


Time Series

When first_column::timestamp. Example


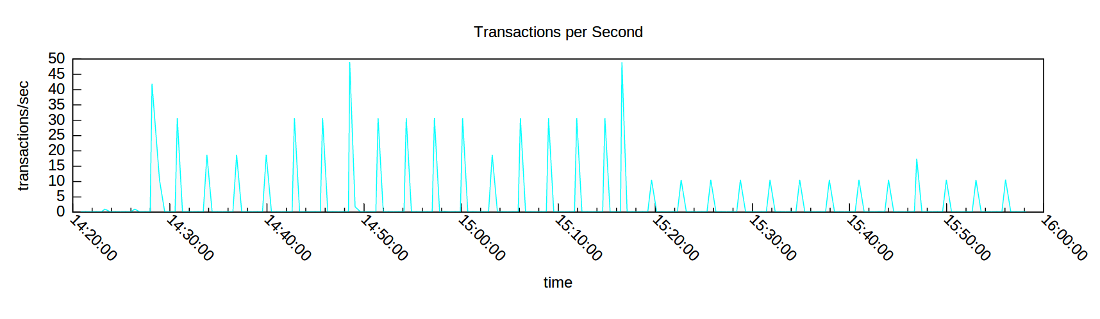
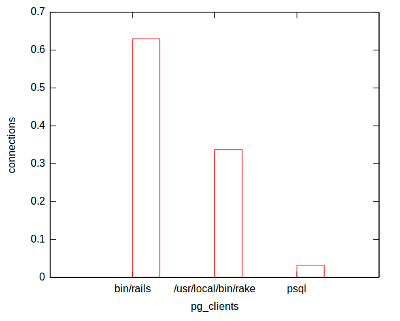
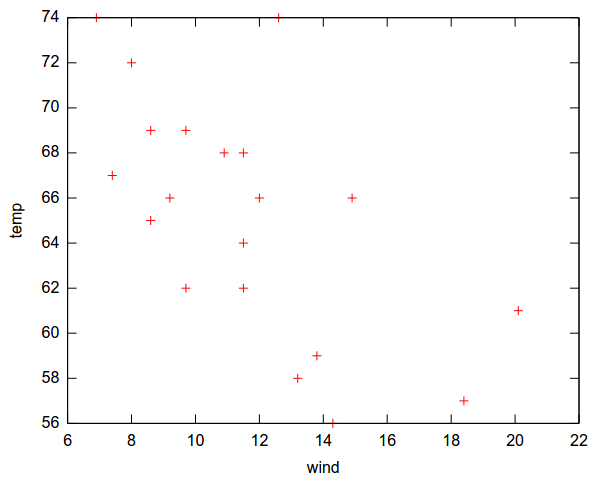
Different result sets, different plots.

The characteristics of the result set will determine plot types. Documentation


Why plot in the database?


"That's where the data is." But really, no particular reason.

Plotpg was developed for an a custom charting facility in pgantenna.